
The Evolution of Incident Documentation
For decades, workplace incident reporting relied heavily on descriptive prose, which often suffers from ambiguity. A worker describing a fall in a "loading area" provides a far less actionable data point than a worker placing a pin on a digital floor plan. Frontline Data Solutions’ introduction of ClickMap represents a broader industry shift toward visual data integration. This transition is consistent with the digitization of industrial safety protocols, where the goal is to reduce the cognitive load on the employee reporting the hazard while simultaneously increasing the precision of the data collected for safety officers.

The implementation of this tool occurs at a time when industrial facilities are increasingly adopting Internet of Things (IoT) sensors and digital twins. By allowing users to upload custom images—such as floor plans or machinery schematics—and apply overlays, ClickMap acts as a bridge between the physical incident and the digital management system. Once a report is submitted, the system permanently archives the marked image alongside the associated incident record, ensuring that the visual context is never lost during subsequent audits or investigations.
Chronology of Safety Tech Integration
The development of ClickMap did not occur in a vacuum. It follows a multi-year trend in the Environmental, Health, and Safety (EHS) software market where vendors have prioritized user interface (UI) improvements to increase report submission rates.
- Early 2020s: EHS platforms focused primarily on mobile accessibility, ensuring workers could submit reports via tablets and smartphones from the factory floor.
- 2024: The industry identified a "description gap," where mobile-friendly forms were still resulting in vague, text-heavy reports that required manual follow-up from safety managers.
- Late 2025: Frontline Data Solutions began the beta testing phase for ClickMap, specifically targeting high-risk environments such as manufacturing, logistics, and heavy industrial processing.
- October 2026: The official launch of ClickMap, marking the integration of visual mapping as a standard feature across the company’s core management modules.
By allowing administrators to configure the mapping feature so that it only appears for relevant report types—such as safety incidents—the tool avoids cluttering the user experience during routine administrative tasks. This conditional logic is a critical component of the software’s design, ensuring that frontline workers are not overwhelmed by unnecessary technical requirements during an emergency.

Analyzing the Data: Why Visual Reporting Matters
Supporting data from the Bureau of Labor Statistics and various occupational safety research bodies consistently highlights that "human error" and "lack of awareness" remain top contributors to workplace injuries. However, these reports often struggle to capture the where of an incident.
When incident data is visualized, safety managers can utilize heat-mapping techniques to identify clusters of near misses. For instance, if an industrial facility consistently receives reports of "tripping hazards" on a specific walkway, a text-based report might not immediately reveal the concentration of the issue. A ClickMap overlay, however, would visually demonstrate that a high volume of incidents is occurring near a specific transition point between the warehouse floor and the loading dock. This allows for evidence-based decision-making regarding infrastructure improvements, such as installing better lighting, adding floor markings, or reconfiguring traffic flow.
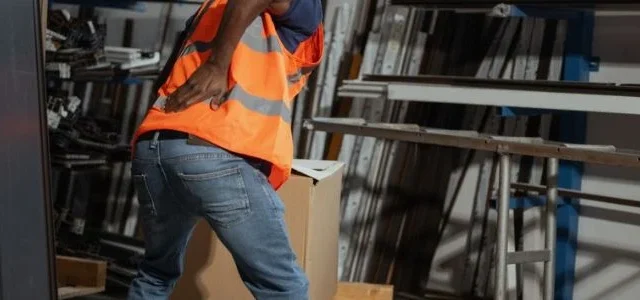
The inclusion of body diagrams for injury reporting also offers significant advantages. By pinpointing the exact location of an injury—such as a repetitive strain issue or a specific laceration—medical teams and safety managers can better track injury trends related to specific equipment or tasks. This granular level of detail is essential for compliance with Occupational Safety and Health Administration (OSHA) reporting standards, which require accurate documentation of work-related injuries and illnesses.

Industry Implications and Expert Perspectives
While Frontline Data Solutions has not released specific internal user metrics, industry analysts suggest that the adoption of visual reporting tools typically leads to a 15–20% increase in incident reporting quality. The rationale is simple: when a tool makes it easier to report an event, the barrier to entry is lowered, and the quality of the report improves because the system captures the "who, what, where, and when" with minimal effort from the reporter.
Safety professionals have long advocated for "visual-first" reporting. "The biggest challenge in safety management is not the lack of data, but the lack of clarity in that data," noted a regional safety consultant familiar with EHS software trends. "If a facility manager has to spend three hours interviewing an employee to figure out which specific part of a machine caused a snag, that is time taken away from remediation. A tool like ClickMap turns that three-hour investigation into a three-second review of an image."
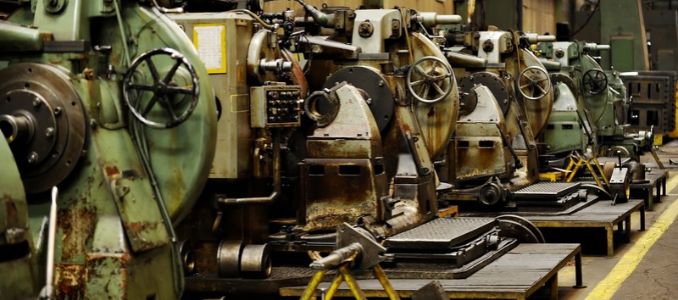
The implication for larger enterprises is substantial. For organizations managing multiple sites, the ability to compile location-based information into customized reports allows corporate safety leads to perform cross-facility comparisons. If Site A and Site B both show an increase in incidents on a similar piece of equipment, the visual mapping can confirm if the issues are occurring at the same mechanical failure point, suggesting a potential design flaw or a need for updated training protocols across the entire organization.
The Role of Administrative Configuration
A key feature of the ClickMap tool is its flexibility. Frontline Data Solutions has clearly recognized that "one size fits all" reporting can often lead to "form fatigue," where workers stop submitting reports because the process is too cumbersome.
By enabling administrators to configure which report forms trigger the mapping feature, the software ensures that visual documentation is reserved for instances where it is most valuable. For example, a safety incident report involving a fall would automatically trigger the facility map, while a routine report concerning office supplies or administrative updates would remain a simple text form. This surgical application of technology is what separates modern EHS software from the legacy systems that preceded them.
Moving Toward Proactive Safety Cultures
The launch of ClickMap is not merely an improvement in documentation; it is a step toward a more proactive safety culture. Historically, safety reporting has been reactive—a log of things that have already gone wrong. By utilizing visual data to spot trends, organizations can pivot toward predictive safety.

If heat maps reveal that near misses are occurring in a specific zone, the safety team can intervene before an injury occurs. They can deploy engineering controls, increase training in that specific zone, or adjust the layout of the facility to mitigate the risk. In this sense, the tool acts as a diagnostic device for organizational health.
As industrial environments become more complex and the pace of production accelerates, the tools used to monitor safety must keep pace. The introduction of ClickMap reflects the ongoing maturation of the EHS sector. By leveraging the power of visual data, Frontline Data Solutions is providing its users with the ability to see their workplace through a more analytical lens, turning disparate incident reports into a cohesive, actionable map of site safety.
The successful deployment of this feature will likely depend on the ease of integration and the willingness of frontline workers to embrace the new reporting format. However, given the current industry trajectory, tools that prioritize spatial awareness and ease of use are positioned to become the new standard in safety management. As safety protocols continue to evolve, the focus will likely remain on reducing the distance between the identification of a hazard and its ultimate mitigation. ClickMap serves as a tangible demonstration of how software can bridge that gap, making workplaces safer one image at a time.